GfK RegioGraph - Award Winning System
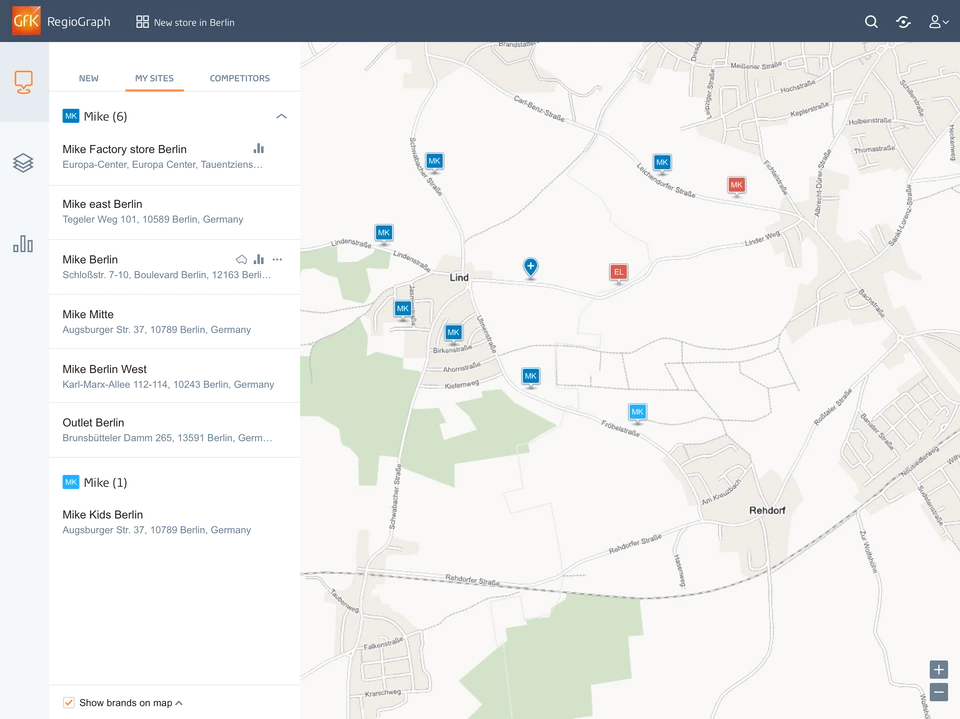
RegioGraph is GfK’s geomarketing system that answers business location questions by displaying data on digital maps. This is the design case study.
- Geomarketing
- GIS
- Market research
- Maps
- Desktop & mobile
- Product
- Geomarketing and market research platforms
- Industry
- Geomarketing
- My role
- UI Designer for RegioGraph, Insight Reporting and PCR
UI Designer for Desktop & mobile products including RegioGraph, Insight Reporting, and PCR. Collaborated with CEO, UX Designers, and developers.
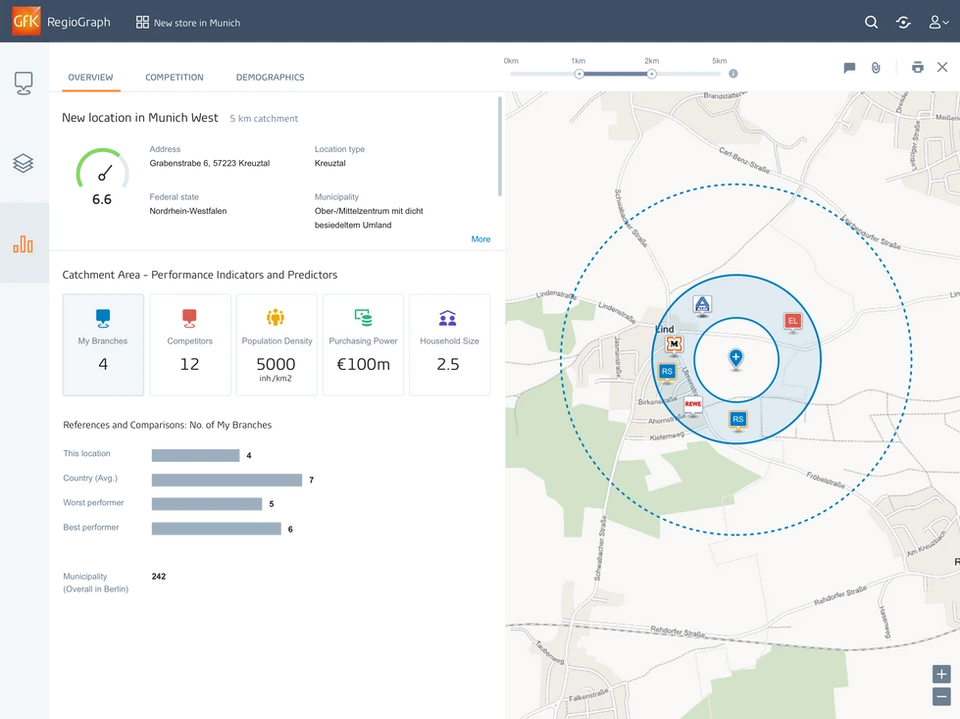
Territories
Territory planning
A catchment area on the map, with performance indicators and potential.
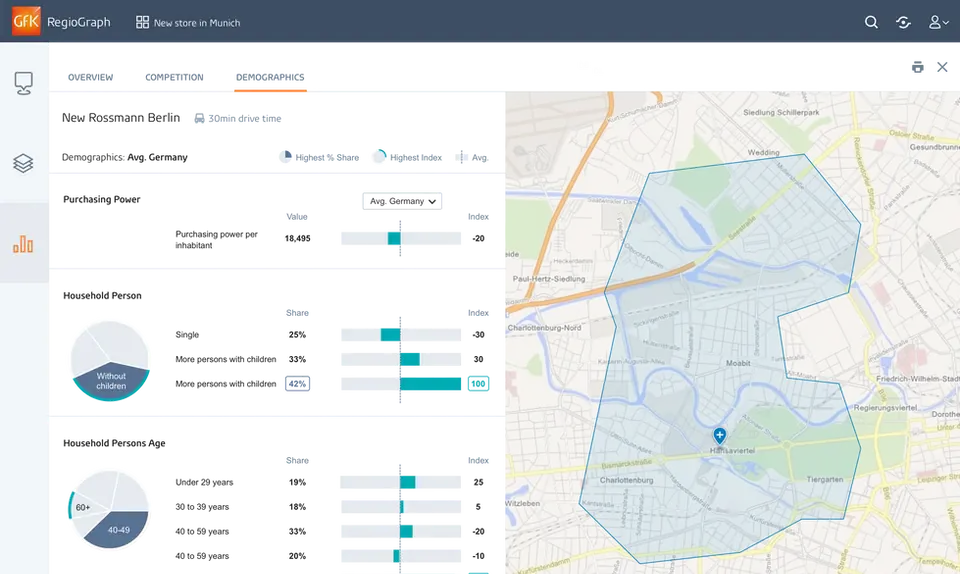
Market indicators
Set the indicators, see the territory
Demographic indicators on the left, the territory highlighted on the map.
Challenge
Dense geographic data layers needed a careful visual hierarchy to stay readable, and users needed precise territorial editing while keeping the overview.
Decision
Layer management with intelligent defaults and progressive customization, territory editing tools optimized for precision, and collaborative map sharing instead of static exports.
Impact
- RegioGraph won Top Retail Product 2017.